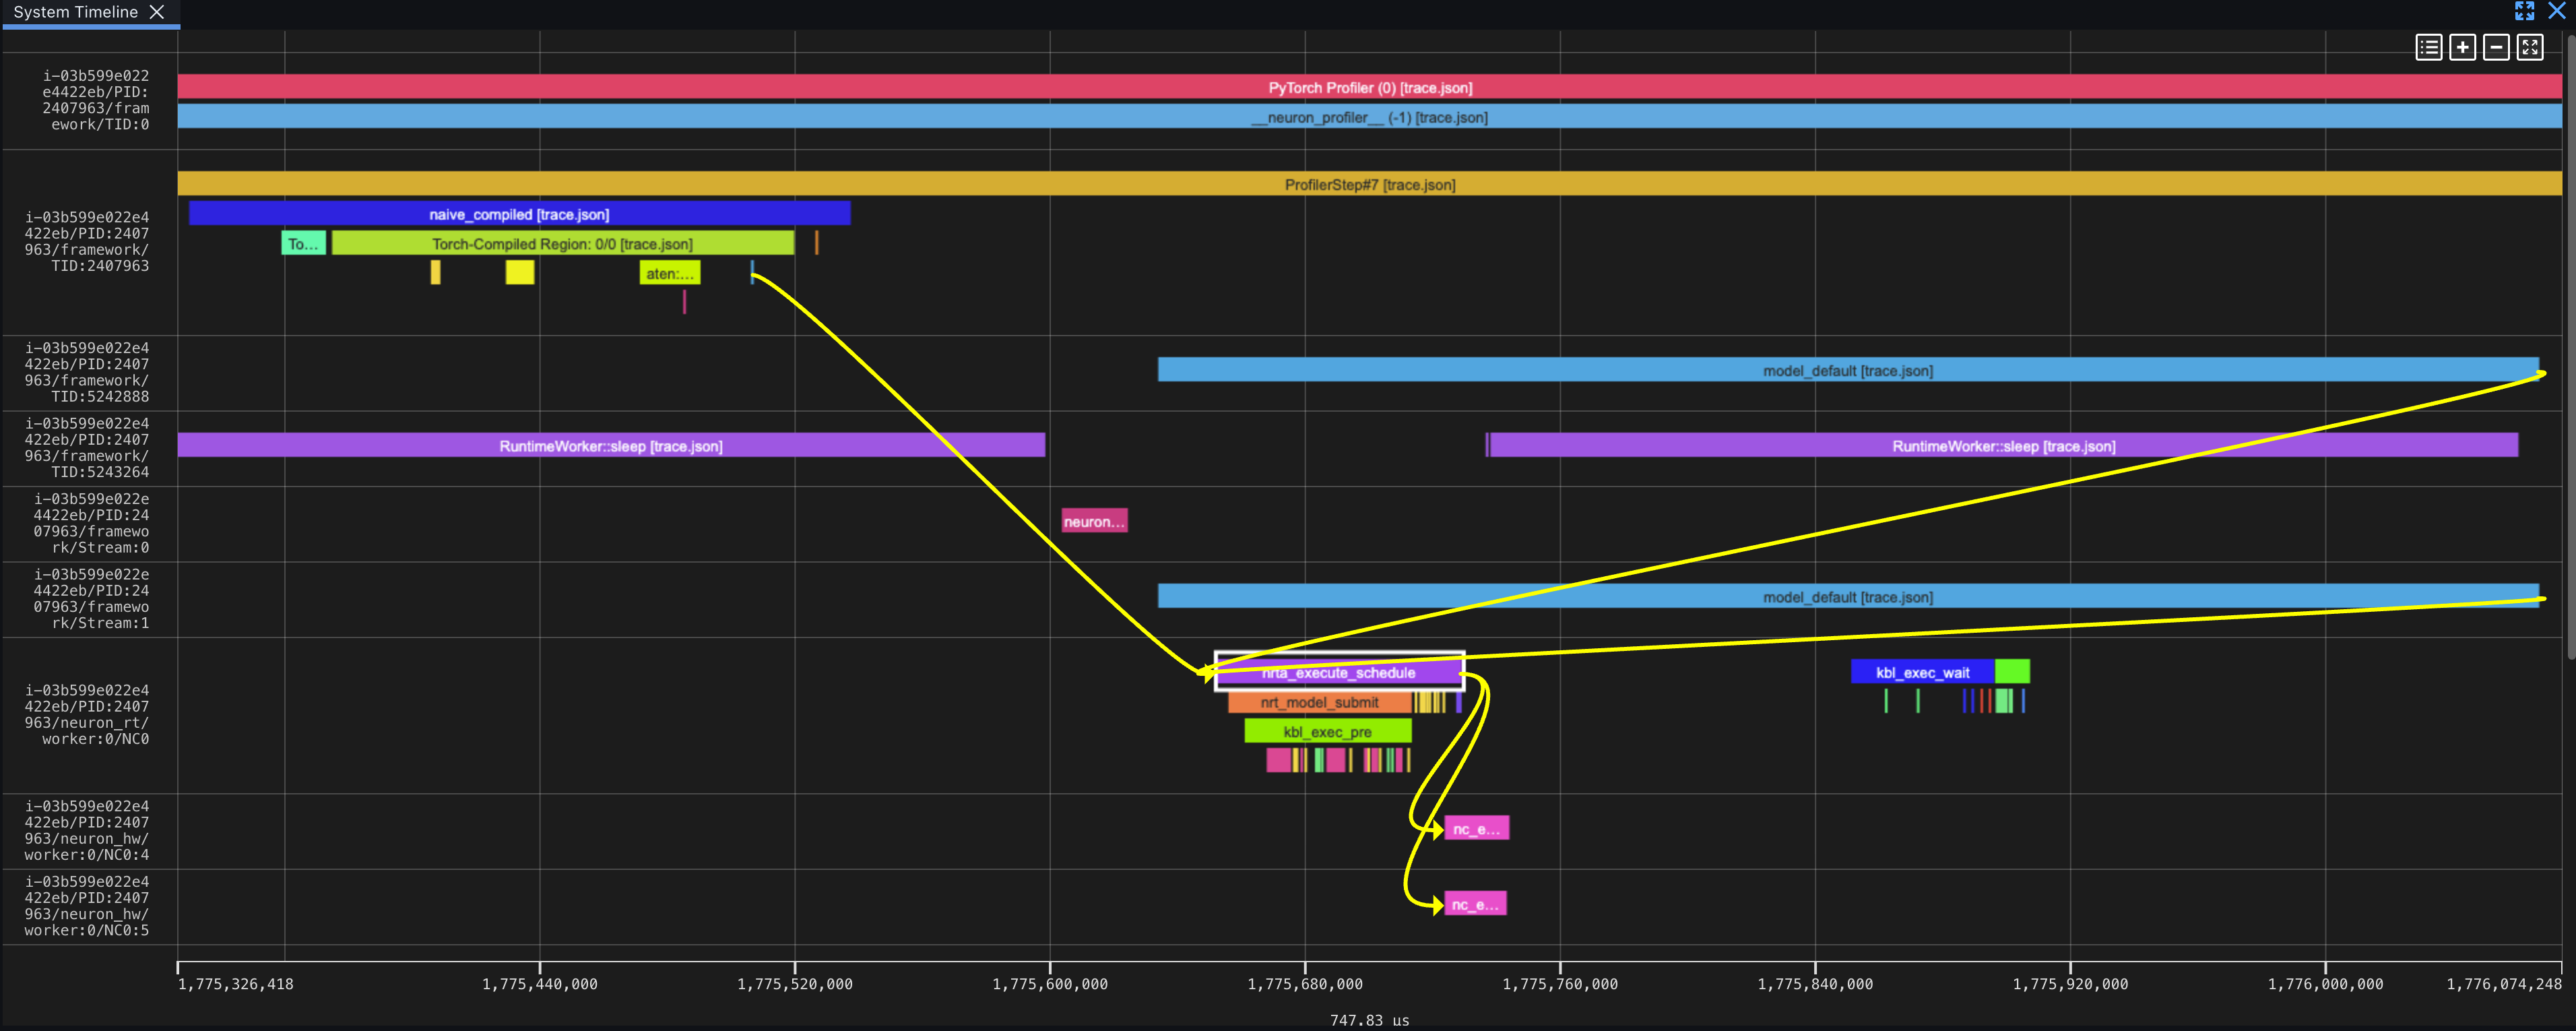
Hugging Face's guide covers system-level performance analysis for AWS Trainium using TorchNeuron and the NeuronProfiler API. It walks through setting up NeuronConfig, capturing device and runtime traces, and analyzing an RMSNorm implementation using Neuron Explorer. The post shows how to wire standard PyTorch profiler steps into the PrivateUse1 backend without modifying core model code.
It is worth reading if you are deploying models on Trainium and need to move past guesswork to trace actual hardware bottlenecks. The catch is that it only covers the mechanics of capturing a trace for a single tiny operation rather than diagnosing a full production model. If you are not targeting AWS silicon, you can safely skip it.
more: https://huggingface.co/blog/amazon/profiling-torchneuron-part-1


Leave a Reply